InsightWorker Logo

Database Health Analyzer

Comprehensive health checks for PostgreSQL, MySQL, and Oracle — analyze performance, identify bottlenecks, and get actionable recommendations.

← All use cases
Database Operations
Database teams, infrastructure engineers, DevOps
PostgreSQLMySQLOracleperformancemonitoring

The problem

  • Database health assessments require manual SQL scripting and interpretation — time-consuming and error-prone.
  • Missing insights on table bloat, unused indexes, slow queries, and connection bottlenecks.
  • No single source of truth for health scoring — each team maintains their own tooling.
  • Recommendations are generic; no actionable, prioritized fixes tied to actual performance impact.

How InsightWorker handles it

1
Connect to PostgreSQL, MySQL, or Oracle and gather comprehensive metadata. 
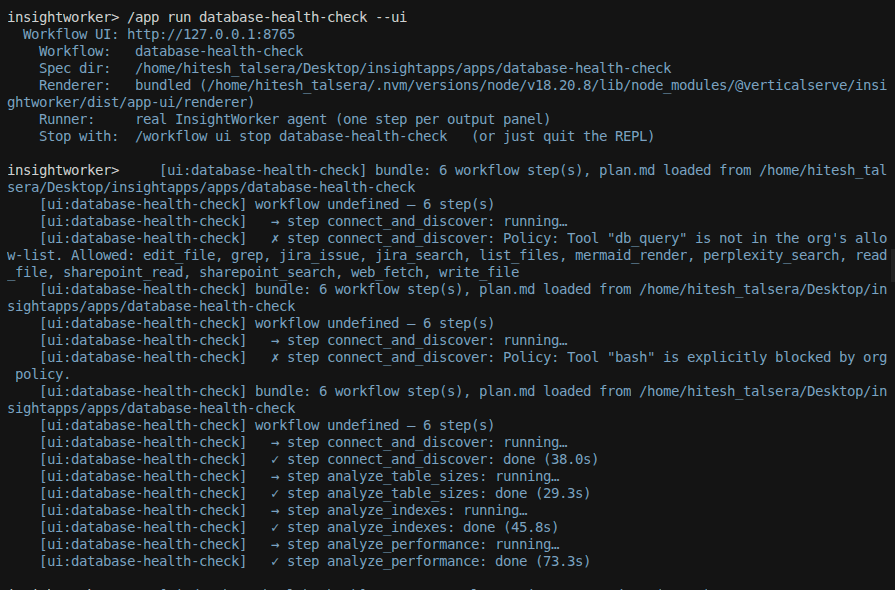
database connection · credentials
2
Query system catalog views — table sizes, row counts, index usage stats, query performance, connection activity, and maintenance health. system catalogs · performance schema
3
Score each health dimension: table/index bloat, cache hit ratios, slow query patterns, dead tuples, lock contention, and connection saturation. health scoring · analytics
4
Generate prioritized recommendations with impact estimates — vacuum, reindex, query rewrites, connection pool tuning. AI analysis · prioritization
5
Deliver a polished Excel report with health scorecards, diagnostic charts, and actionable fix checklists. create_excel · charting

Sample prompt

"Analyze the health of my production Oracle database — table bloat, unused indexes, slow queries, and give me a ranked list of fixes with effort vs. impact."
Deliverables: health_report.xlsx · scorecard_dashboard · recommendations.md · diagnostic_charts.png

Screenshots

Database Health Dashboard

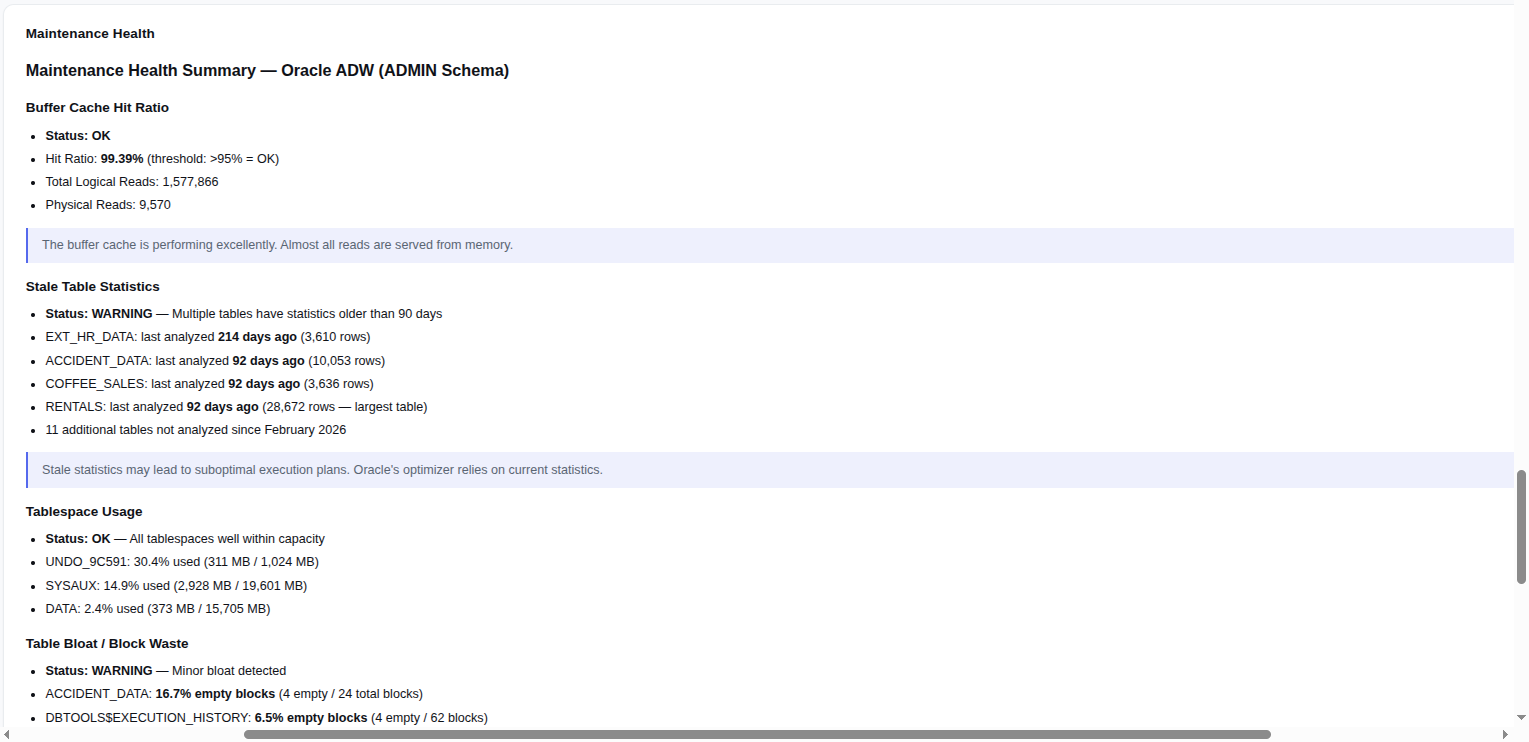
Database Health Dashboard — comprehensive health scoring with key metrics and dimensions.

Table Bloat Analysis

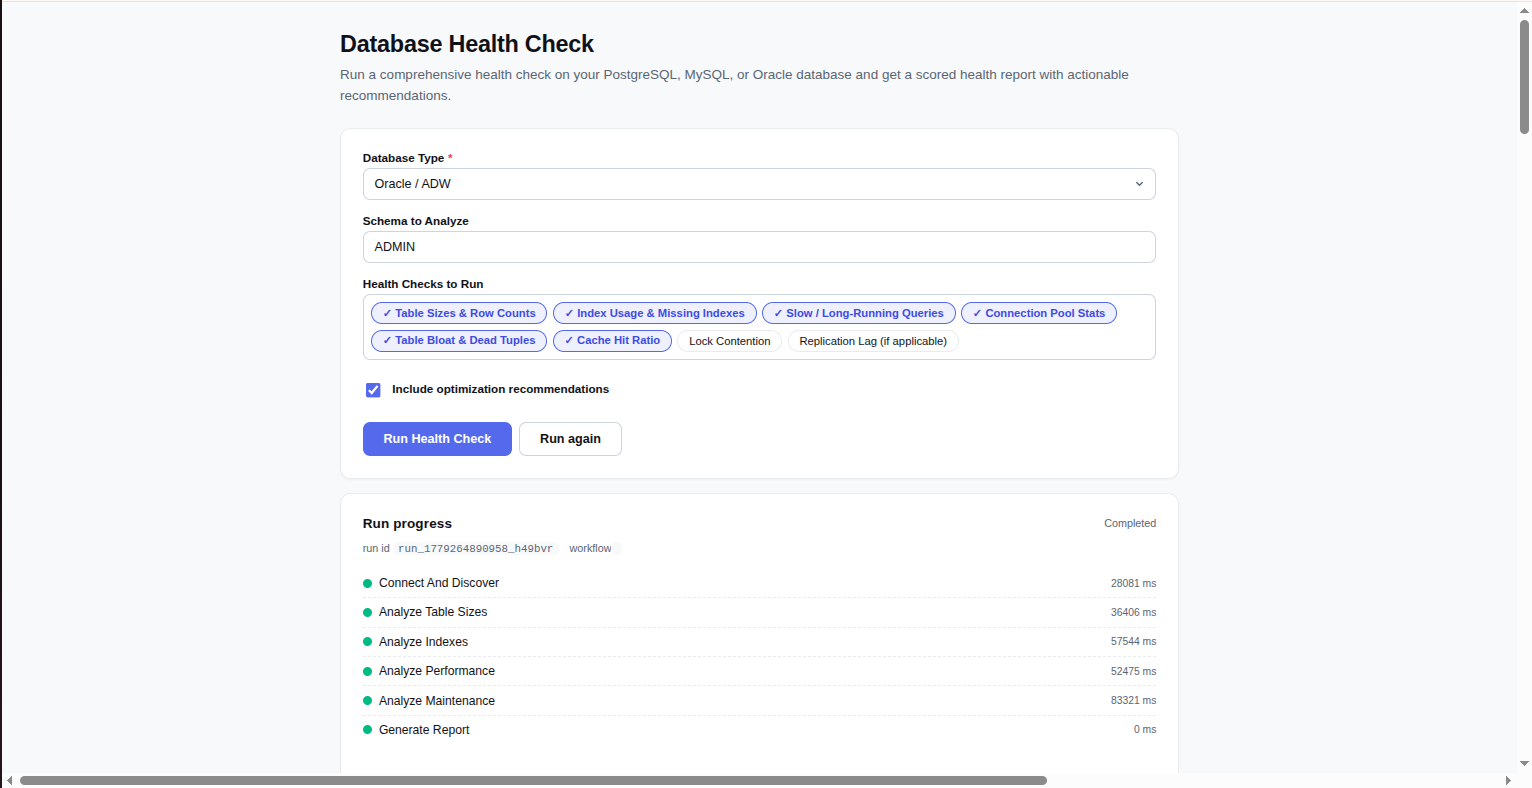
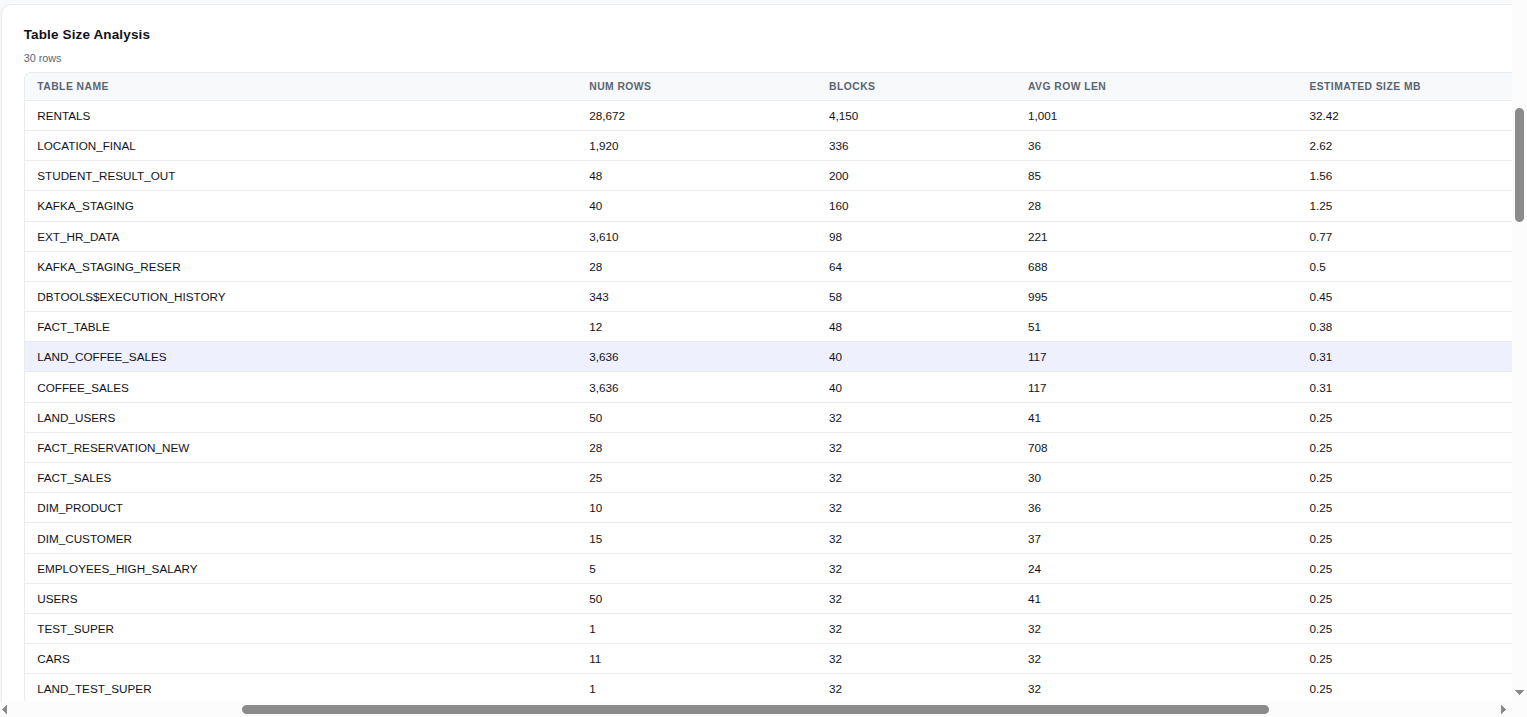
Table Bloat Analysis — identifies oversized tables with wasted space and dead tuples.

Index Usage Report

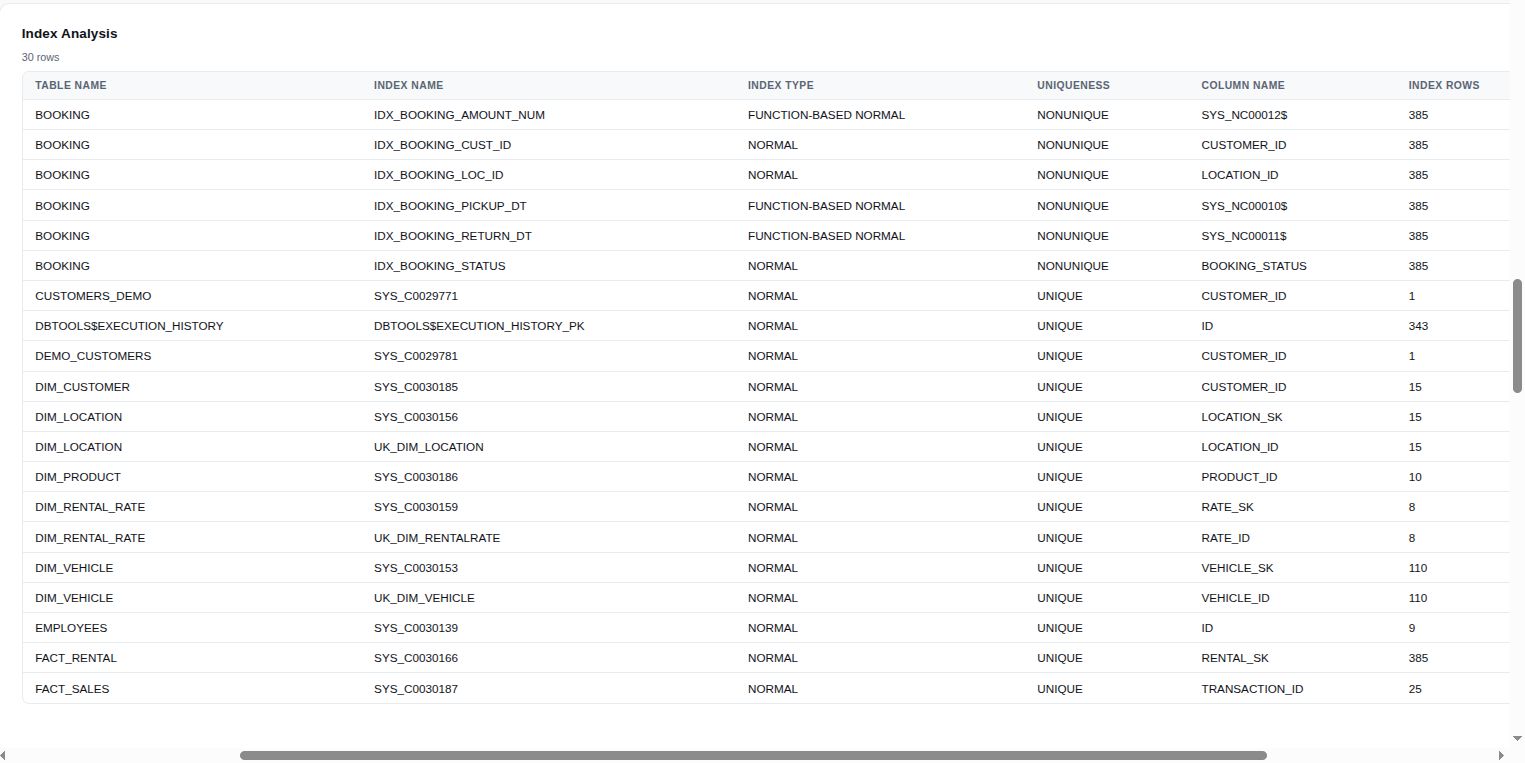
Index Usage Report — finds unused or redundant indexes consuming disk space.

Query Performance Analysis

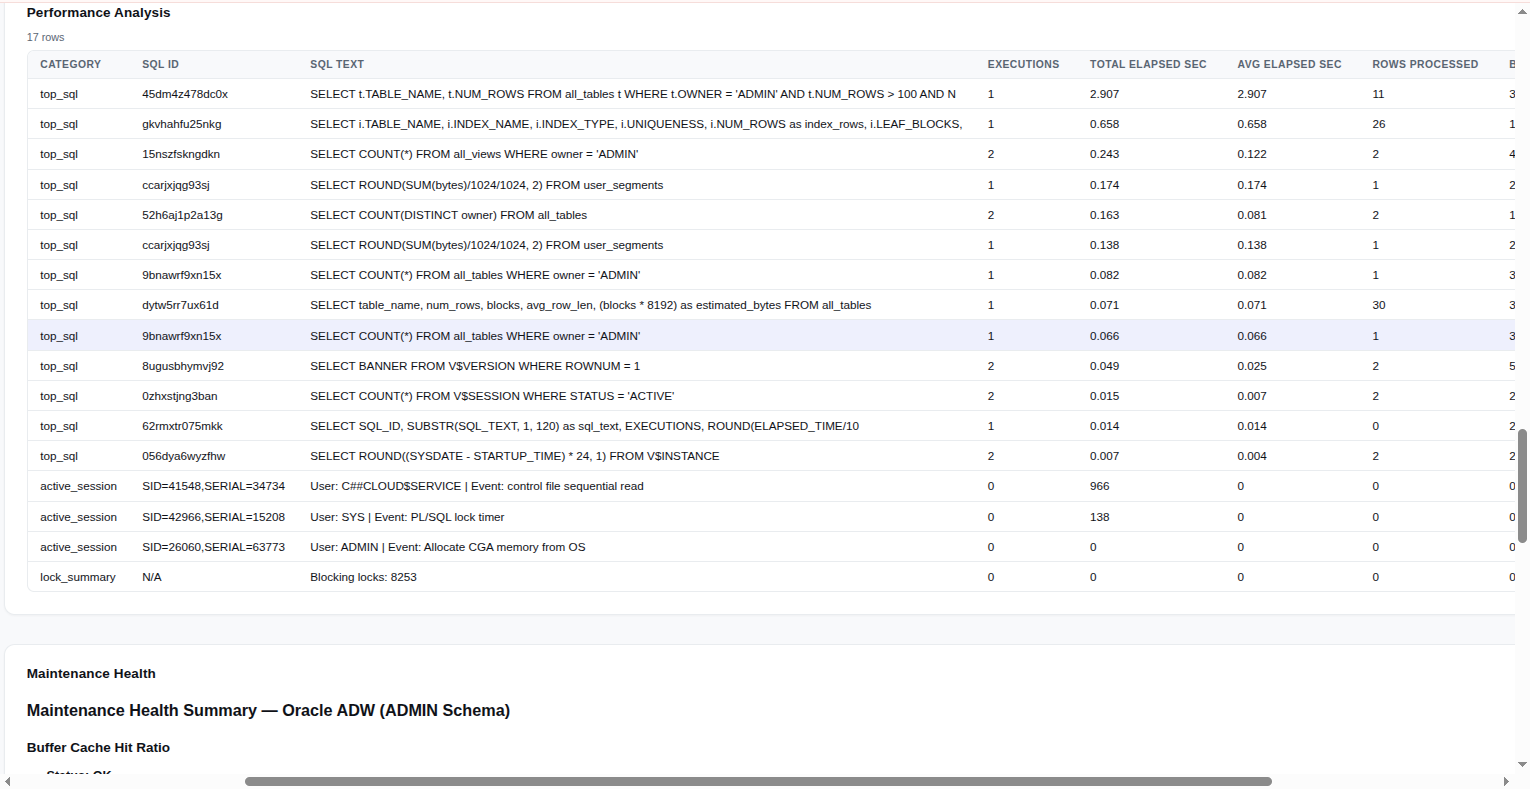
Query Performance Analysis — detects slow queries and inefficient execution plans.

Cache Hit Ratio Metrics

Cache Hit Ratio Metrics — measures buffer pool efficiency and memory allocation.

Recommendations Dashboard

Recommendations Dashboard — prioritized fixes with impact estimates and effort levels.

Health Score Summary

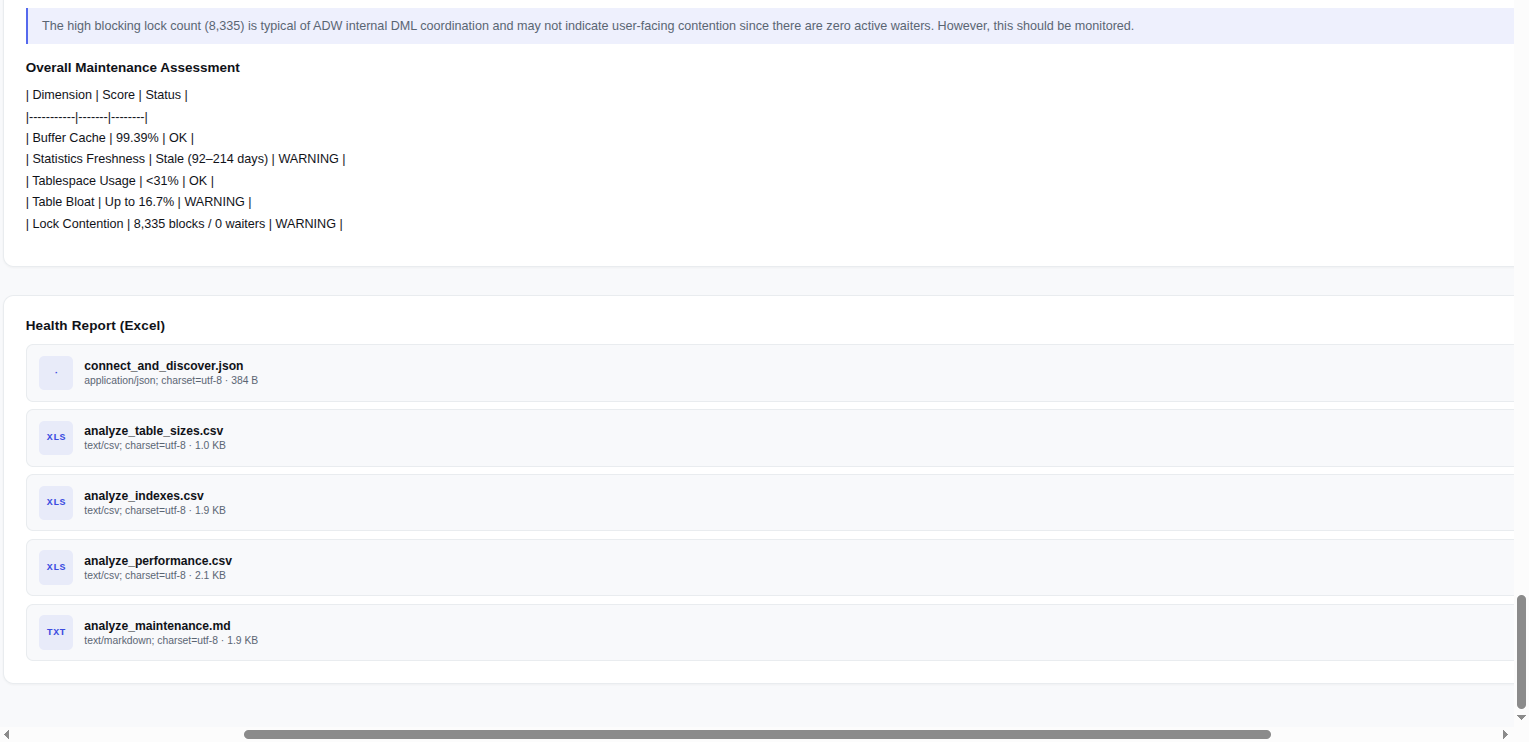
Health Score Summary — overall database health with visual scorecard and trend analysis.

Health Dimensions Analyzed

  • Table & Index Bloat: Identify oversized tables and wasted space due to dead tuples or fragmentation.
  • Index Usage: Find unused or redundant indexes consuming disk and slowing writes.
  • Query Performance: Detect slow queries, missing indexes, and inefficient execution plans.
  • Cache Efficiency: Measure buffer pool / cache hit ratios and memory allocation.
  • Connection Health: Monitor active sessions, idle connections, and pool saturation.
  • Lock Contention: Identify lock waits and deadlock patterns.
  • Maintenance Status: Track vacuum, autovacuum, and maintenance task health.
Prefer the browser?
Run this in InsightStudio — no CLI install for the user.

Authors publish the app once with iw app publish; business users open it in the marketplace and click Run. Your worker box does the execution.

Visit InsightStudio →

Try this use case yourself

Free trial available — CLI, Desktop, VS Code, and the new --worker mode for InsightStudio. See download for details.

Download Free Trial