InsightWorker Logo
  • contact@verticalserve.com

Data Quality Reporter (CSV/Parquet)

Automatically profile data and generate an Excel/PPT quality report — schema, nulls, duplicates, ranges, and outliers.

← All use cases
Data Validation
Files at rest or in object stores; ad-hoc or scheduled checks
CSVParquetdata qualityprofilingExcelPowerPoint

The problem

  • Teams rely on manual spot checks of CSV/Parquet before ingest — errors slip through.
  • No standard quality rubric — every analyst checks different things.
  • Findings are not packaged into a shareable report for stakeholders.

How InsightWorker handles it

1
Locate and load the file from local path or object storage (S3, GCS, Azure Blob, SharePoint). read_file · sharepoint_read
2
Infer schema and data types; sample large files efficiently. pandas · pyarrow
3
Run quality checks: nulls %, uniqueness/duplicates, value ranges, categorical cardinality, regex patterns, and outliers (IQR/Z-score). 
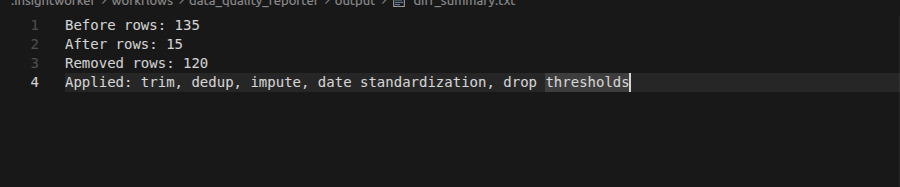
python · profiling rules
4
Generate an Excel workbook and an optional PPT summary with charts and flagged issues. 
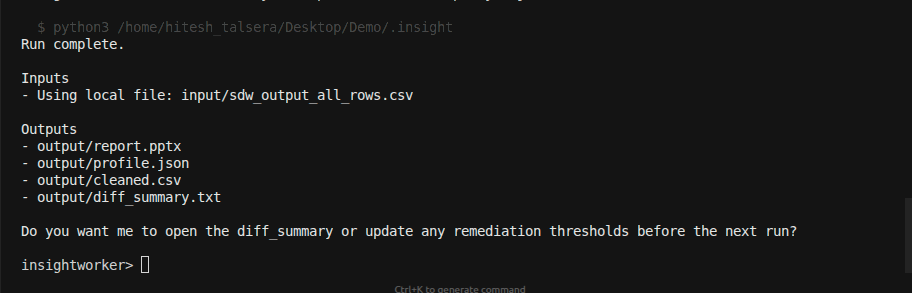
create_excel · create_pptx
5
Email or save to SharePoint; wire into a schedule for recurring feeds. send_email · sharepoint_list

Screenshots

Data quality column profiling overview

Column profiling overview

Per-column types, null %, distinct counts, and basic stats from the profiler.

Data distributions and outliers

Distributions and outliers

Numeric histograms and categorical top-k with flagged outliers and anomalies.

Raw data before cleanup

Before cleanup

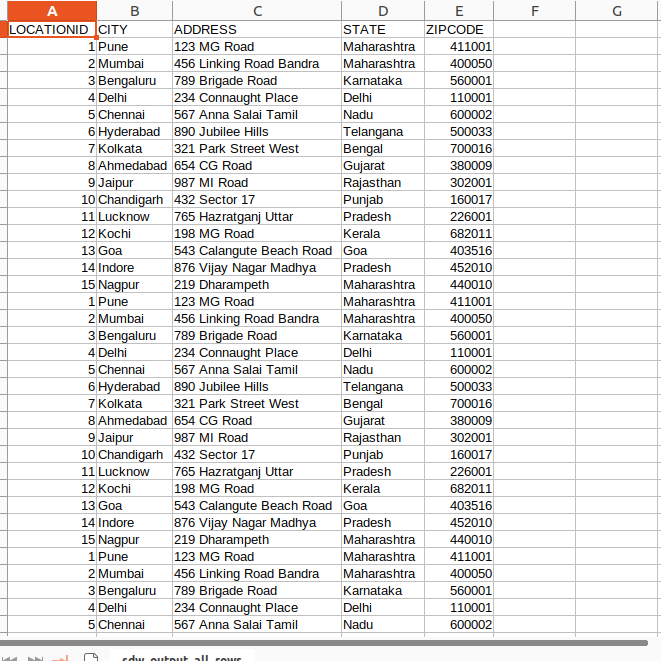
Example of source data with missing values, inconsistent types, and out-of-range entries.

Cleaned data after remediation

After remediation

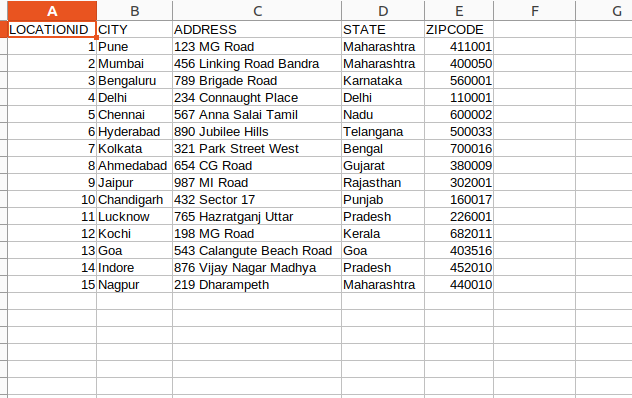
Post-fix snapshot highlighting resolved issues and improved data quality metrics.

Sample prompt

"Generate a data quality report for this input and email me the Excel/PPT: ./input/location.csv"

What’s inside the report

  • Column overview: inferred type, distinct count, null %, min/max, example values
  • Data health: duplicate row analysis, primary-key candidate checks
  • Distribution snapshots: histograms for numerics, top-k for categoricals
  • Rule exceptions: regex mismatches (emails, phones), out-of-range values
  • Summary sheet: prioritized issues and recommended remediation
Example CLI usage insightworker /app run data-quality-reporter --ui # then fill the widget form with the source path + report destination, # or run non-interactively from the REPL: insightworker -c "/app run data-quality-reporter \ --path s3://acme-raw/customers/2026/05/01/customers.parquet \ --out ./reports/customers_quality"
Prefer the browser?
Run this in InsightStudio — no CLI install for the user.

Authors publish the app once with iw app publish; business users open it in the marketplace and click Run. Your worker box does the execution.

Visit InsightStudio →

Try this use case yourself

Free trial available — CLI, Desktop, VS Code, and the new --worker mode for InsightStudio. See download for details.

Download Free Trial